📊 PMM Server on the SaveinCloud Platform
This guide was created to assist with the installation and configuration of PMM Server (Percona Monitoring and Management) on the SaveinCloud PaaS platform, providing a complete solution for database observability and monitoring.
🔍 Monitor databases such as MySQL, MariaDB, PostgreSQL, and MongoDB with comprehensive dashboards, alerts, and performance analysis.
🚀 Installation via Marketplace
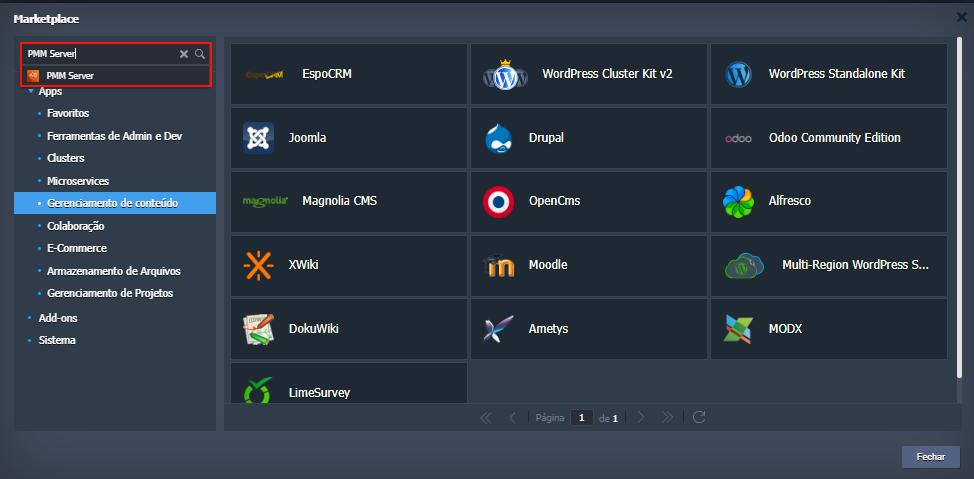
- Access the SaveinCloud panel and click on MARKETPLACE.
- Search for
PMM Server. - Choose the environment name you want to create and the desired region.
🔐 Accessing the Web Panel
After the environment is created, access is done via browser with the login details sent by email:
- User: admin
- Password: Sent in the environment creation email
Do not forget to change the default password after the first login
Initial login screen:

🔑 We recommend changing the password on first login.
🗺️ Dashboard Overview
PMM offers comprehensive dashboards for:
- Query Analytics (QAN)
- Instance Monitoring (Node Exporter, MySQL, PostgreSQL, MongoDB)
- Disk, CPU, RAM, and I/O Usage
- Alerts via Integrated Grafana
- History of Heavy and Slow Queries
Dashboard example:

🔌 How to Connect Your Databases to PMM
▶️ Installing the agent on the database server
Access your server via SSH and run:
sudo docker pull percona/pmm-client:2
▶️ Registering the server in PMM:
sudo docker run -d --restart always --name pmm-client -e PMM_SERVER=https://<IP_ou_Domínio_do_PMM> -e PMM_USER=admin -e PMM_PASSWORD='<sua_senha>' percona/pmm-client:2 watch
▶️ Adding MySQL or PostgreSQL monitoring:
sudo docker exec -it pmm-client pmm-admin add mysql --username=root --password=<senha_do_mysql> --server-url=https://admin:<sua_senha>@<IP_do_PMM>
Or for PostgreSQL:
sudo docker exec -it pmm-client pmm-admin add postgresql --username=postgres --password=<senha> --server-url=https://admin:<sua_senha>@<IP_do_PMM>
✅ From this moment, the server will start sending metrics to PMM.
🔧 Port Structure
| Service | Port | Description |
|---|---|---|
| Web Panel | 443 | HTTPS Access |
| Web Panel (optional) | 80 | HTTP → HTTPS Redirection |
| Agent → PMM Server | 443 | Metrics sending via HTTPS |
🛡️ Security Best Practices
- 🔒 Always use HTTPS (port 443).
- Create users with specific permissions in the database, exclusive for PMM.
- If no external access is needed, use a private IP.
- Configure the instance firewall to accept connections only from authorized IPs.
🚀 Optimization and Performance
- Constantly monitor resource consumption on the panel.
- PMM consumes about 2~4 GB of RAM depending on the number of monitored instances.
- Use fast storage (High Performance) for better dashboard performance.
🧠 Frequently Asked Questions
❓ Can I monitor databases outside SaveinCloud?
✅ Yes. Provided the database instance allows external access and PMM port 443 is open for external connections.
❓ Does PMM have a cost?
✅ You only pay for the infrastructure (CPU, RAM, and Storage). The PMM Server tool is open-source and free.
📚 Documentation and Resources
🧠 Support
If you have questions or need help, contact SaveinCloud support.