📊 Manage your instance's consumption easily
Statistics monitoring allows you to track in real time the usage of your instance's resources, such as RAM, network, CPU, and disk.
👁️ Viewing instance statistics
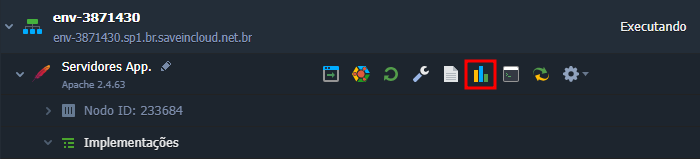
To view the resources of the desired instance, click on the statistics icon highlighted in your instance's interface.
Once opened, a panel with detailed charts of all resources will be displayed. You can filter the data by checking the boxes at the top of the panel.
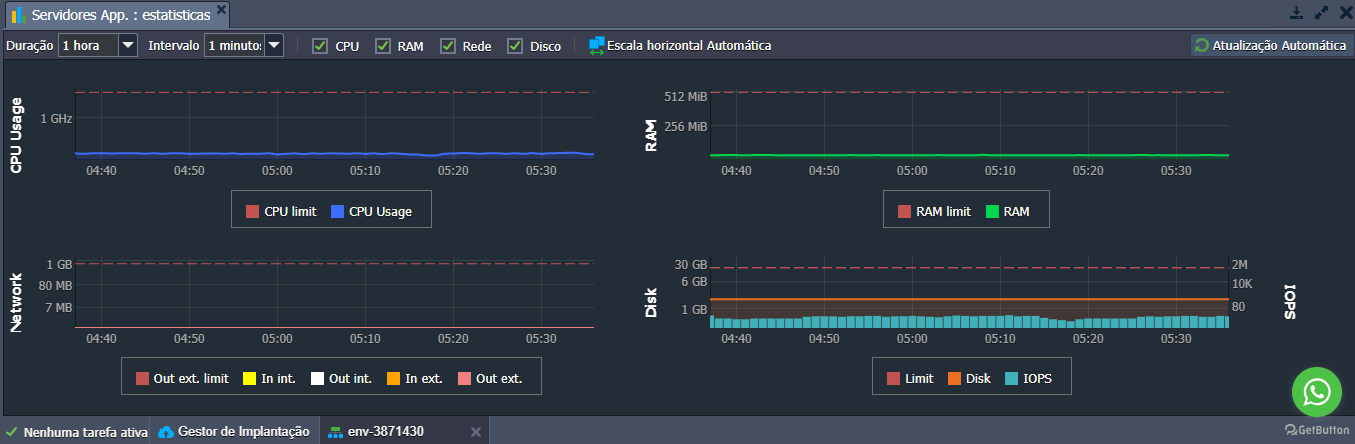
- RAM: memory consumption (in MiB);
- CPU: processing usage (in MHz);
- Network: internal and external network traffic (in MiB);
- Disk: used space (in MiB) and I/O operations (in IOPS).
🌐 Network resource details
Network statistics provide detailed information about internal and external traffic:
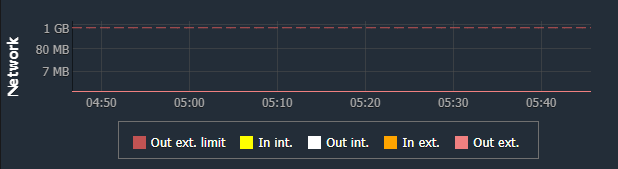
- Out ext. limit: outgoing traffic limit for external networks;
- In int: incoming traffic on the private network;
- Out int: outgoing traffic on the private network;
- In ext: incoming traffic from the internet (public network);
- Out ext: outgoing traffic to the internet (public network).
💽 Disk and IOPS
For a detailed view of disk usage and I/O operations, hover the mouse over the chart to display the following information:
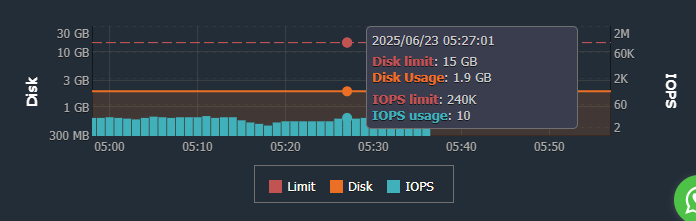
- Disk limit: total disk capacity of the instance;
- Disk usage: used disk space;
- IOPS limit: maximum number of allowed input/output operations;
- IOPS usage: current number of I/O operations in the monitored period.
Statistics are collected every minute and stored in one-hour intervals, providing greater accuracy in usage billing.
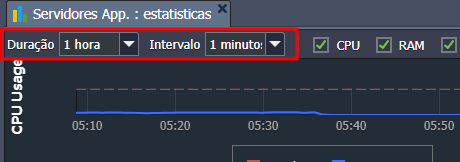
To view a different period, use the time interval filter:
🧠 Questions?
Have any questions? Contact our technical support. We are ready to help you!